
I probably should give a little lesson on how to read a spectrogram, since my next post will feature spectrograms rather heavily. I made all these spectrograms on PRAAT, which is free and downloadable if you wish to play with it. (I know the website looks a little sketch, but I had to get it for my classes using the site I linked to and it's totally safe for your computer.) PRAAT is a lovely piece of software that will record a sound and then give you both a spectrogram and a waveform of that sound. As you look at the images below, the waveform is the image on the top with the thick black band and blue vertical lines, and the spectrogram is the grey-scale mess below that waveform. So, on to the important part of this post!
How to read a spectrogram:
The x-axis (horizontal) is time, the y-axis (vertical) is frequency, and the grey-scale shows amplitude. So a spectrogram can show three dimensions, time, frequency, and amplitude vs. a waveform that shows only two, time and frequency. On fancier programs, the amplitude is sometimes shown in color, like having blue be the softest sounds and red being the loudest, but in PRAAT, the darker the band, the higher the amplitude. In terms of the frequencies, I set the spectrograms to show from 0 Hz to 7000 Hz. PRAAT can display up to 20,000 Hz, but then the formant bands I want to focus on get too squished together. If you click and make the image bigger, you can see a dotted red line with a frequency number off to the left. I set those lines there just to give you some idea of where the upper formant lies in terms of Hz. And remember from the last post that the formant will be somewhere around this frequency, not right at the single frequency itself.
So this is what a typical spectrogram will look like with the upper frequency set at 7000 Hz. (I think PRAAT's default setting is usually 5000 Hz.):
So this is what a typical spectrogram will look like with the upper frequency set at 7000 Hz. (I think PRAAT's default setting is usually 5000 Hz.):
 |
 |
| Sustained-speech of an /a/ vowel with formants marked. |
 |
| Sustained, spoken /i/ vowel, no formants marked in. |
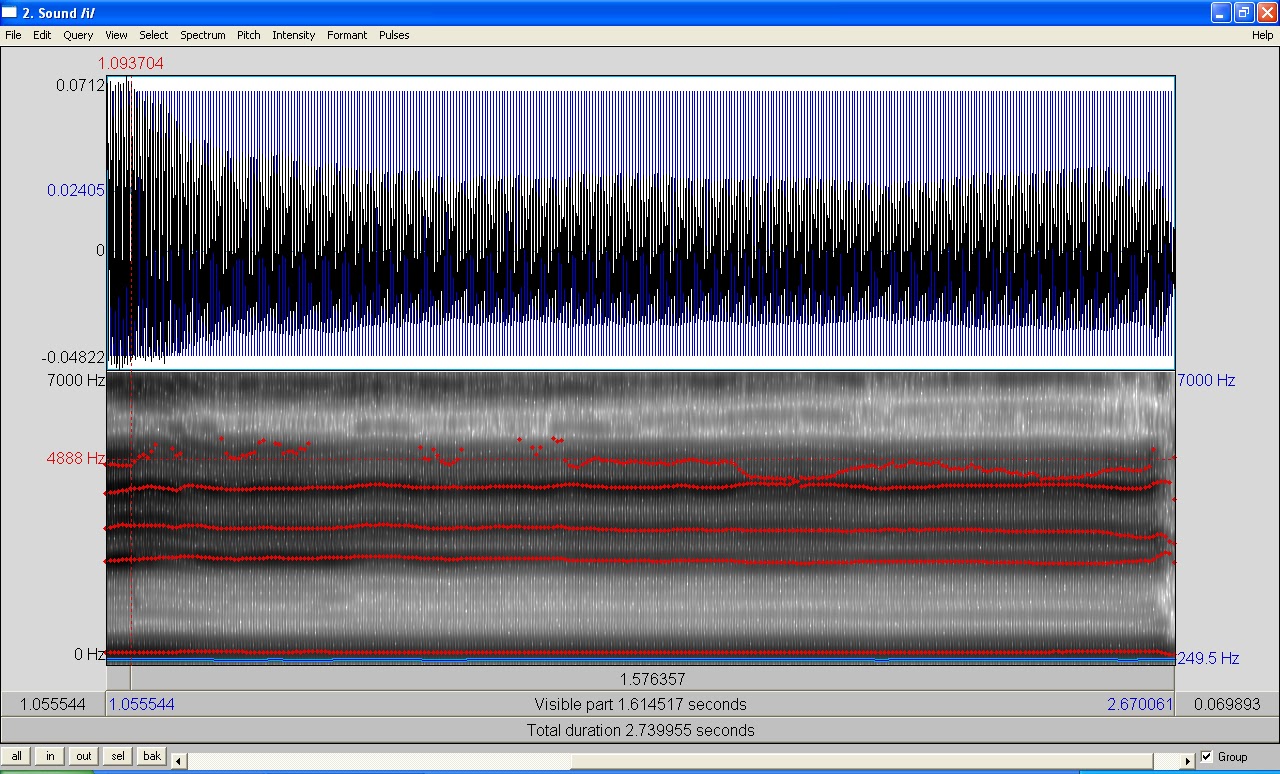 |
| Sustained, spoken /i/ vowel, first five formants marked in red. |
 |
| Spoken phrase: "One, two, three, go," no formants marked. |
 |
| "One, two, three, go," with formants marked in red. |
Now, some super cool people can actually read spectrograms like they're reading words off the page. I'm not quite that awesome yet, but if you tell me what the phrase is, I can pick out where each specific word is using my knowledge of vowel formants and consonant frequencies. It'd be cool to become that person who can just read them, though!
Now the reason I kept setting the spectrogram to 7000 Hz instead of 5000 is two-fold: First, I wanted to make sure the upper formant wasn't cut off since that formant does occasionally go higher than 5000 Hz, and second, I wanted you to see that there actually is a thick band of amplitude above the 5000 Hz mark, which you can see in the spectrogram above. So there are more "formants" above that 5000 Hz mark...we just don't really regard frequencies higher than 5000 when discussing speech or singing very much. (Although, this article does!) Heck, PRAAT doesn't even mark in any formants above the 5000 Hz area...usually the fifth formant area. But, I wanted to make sure you know that it's not like formants and harmonics just disappear above 5000 Hz. Mathematically speaking, harmonics would just keep on going higher and higher, and so would formants. However, the amplitude lessens the higher you go, so vocal harmonics and formants do dampen out eventually...just not at 5000 Hz.
Up next: The singer's formant! I'mma gonna break apart a common misconception in the hopes that it clarifies what is we're actually doing when we carry over that orchestra.
1 comment:
Hi Kim, I know you haven't updated this blog for several years, but I want you to know I came across it a little while ago and have been touched and inspired by your journey. I just graduated with my BM and am considering speech/voice pathology as a career. Your entries have been very helpful to me, especially those concerning your transition out of performing into this field. It's a terrifying choice to make. The scientific posts have been fascinating and entertaining as well! I know you may never see this, but thank you for this blog. I would love to know how your journey has continued recently.
-Grace
Post a Comment